Fabric activity
10.54%active-cycle ratio
3,263 active · 27,682 idle cycles
Evidence checkpoints · updated 23 October 2026
Results below retain their individual dates, configurations and measurement windows. October 23 package-v4 work is implemented and under verification; no new performance measurement is claimed.
ZilionX evidence spans RTL simulation, numerical verification and scoped FPGA implementation-tool results. Historical compute, DMA and token-stress measurements are preserved below.
These are separate development checkpoints, not one combined performance result. Small RTL tests use eight layers, four tokens and dimension 8. No production-model throughput, power, accuracy or competing-device advantage is established.
| Checkpoint | Configuration and comparison | Result | Evidence and limitation |
|---|---|---|---|
| GQA/RoPE golden suites | 4Q/2KV; seven eight-layer suites | 56/56 layer comparisons | RTL versus golden vectors; tiny numerical test scope |
| Queued descriptor DMA · 17 October | Raw / explicit descriptor / queued; seven suites each | 168 matching layer comparisons; load 1,874 / 1,973 / 1,901 cycles; end-to-end 36,099 / 36,198 / 36,126 cycles | RTL simulation; inference 34,225 cycles in each; source revision and full conditions |
| Four-phase RoPE | Four-phase versus parallel RoPE | 76 versus 88 DSP; 34,225 versus 34,177 inference cycles | Implementation resource and simulation evidence; fewer DSPs with 48 additional cycles, not a speedup |
| ECP5 routed timing | 4Q/2KV with four-phase RoPE; 20 MHz target | 22.08 MHz | Out-of-context place-and-route; not physical-board or full-system timing |
| GQA cycle comparison | 4Q/4KV versus 4Q/2KV; eight layers, four tokens, dimension 8 | 36,161 → 34,113 inference cycles; 5.66% reduction | Matched RTL simulation checkpoint; not the later RoPE/DMA configuration or full-model speedup |
Historical checkpoint revisions and original reports remain below. Missing tool versions, seeds or settings must be obtained from the underlying report before attempting reproduction; no unstated configuration is assumed.
23 October 2026 · implemented / under verification
This is a development evidence checkpoint, not a new measured performance result. The published checkpoint and supplied repository history record the following implementation work:
| Revision | Implementation | Public status |
|---|---|---|
0ffb129 | Calibrated Qwen2 checkpoint conversion to package v4 | Implemented / under verification |
308b028 | Guarded package-v4 scaled RTL execution | Implemented / under verification |
029127c | Validated parameter and requantization DMA loading | Implemented / under verification |
ba83fcb, a82ba36 | Attention score correction and record arbitration | Implemented / under verification |
f11fdb7, d738f8e, 7653d43, ee22efa | Attention output/context requantization and record arbitration | Implemented / under verification |
6c4a4e8, 73afc4d, 1e81d5f, 5869ed2, cb0b5f8 | SwiGLU multiply and FFN gate/up/down requantization and related record work | Implemented / under verification |
Evidence boundary: Commit descriptions document implementation; they do not establish full Qwen2 inference, model accuracy, model-scale hardware validation, new cycle counts or physical-board performance. The October 23 work has no new routed frequency or benchmark measurement reported here.
Revision provenance: the integration revisions listed above, except 0ffb129, are present in the locally available repository history. The Qwen2 conversion reference 0ffb129 is retained from the published checkpoint and was not independently located in that local snapshot. Commit presence is not a rerun of verification.
The Stage 3N GQA/RoPE checkpoint passed seven eight-layer golden-vector suites and 56/56 layer comparisons for 4 tokens × D=8 × 8 layers with 4Q/2KV. The four-phase ECP5 routed result is 22.08 MHz against a 20 MHz target. These results retain their original checkpoint scope and are not verification of the entire package-v4 path.
Verified repository tags include stage3n-streaming-dma-verified, stage3n-overlapped-preload-verified, stage3n-dma-weight-bypass-verified, stage3n-descriptor-dma-verified and stage3n-queued-descriptor-dma-verified. Detailed historical measurements follow.
11 October inference cycles · 4 tokens × D=8 · 8 layers
Overlapped-preload end-to-end cycles · cache warm-up overlaps DMA
Compute fabric request stall client-cycles
Verified checkpoint · 11 October 2026
For four tokens, dimension D=8 and eight layers, the measured simulation accounting closes: 2,002 load + 337 warm-up + 31,553 inference = 33,892 end-to-end cycles. This is a small verification configuration, not a full deployed LLM workload.
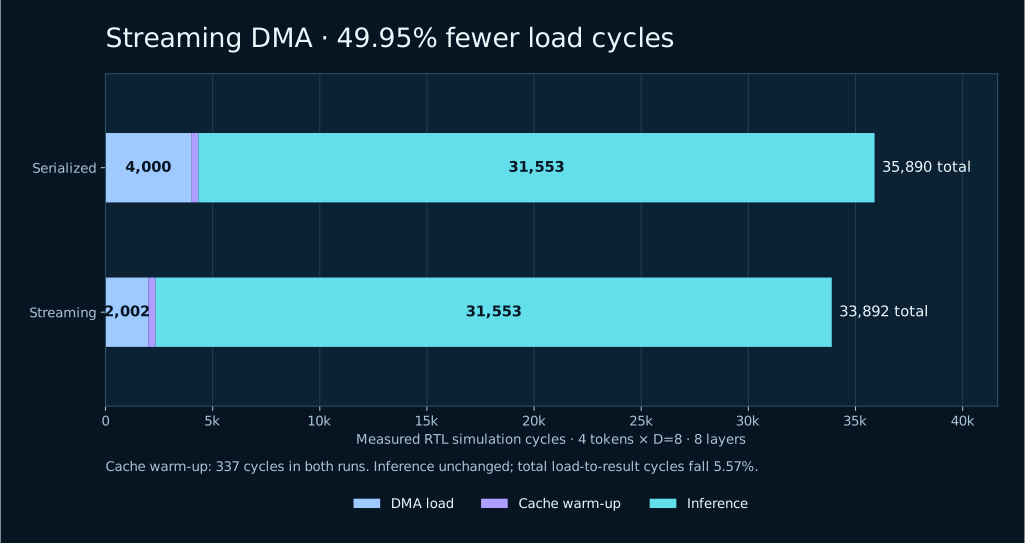
| Metric | Serialized reference | Streaming checkpoint |
|---|---|---|
| DMA load cycles | 4,000 | 2,002 |
| Cache warm-up cycles | 337 | 337 |
| Inference cycles | 31,553 | 31,553 |
| End-to-end cycles | 35,890 | 33,892 |
| Payload bytes per cycle | 2.0 | 3.996 |
| Phase | Cycles | Calculated at reported 20 MHz |
|---|---|---|
| DMA model and activation load | 2,002 | 0.10010 ms |
| Layer-0 cache warm-up | 337 | 0.01685 ms |
| Eight-layer inference | 31,553 | 1.57765 ms |
| Total load to result | 33,892 | 1.69460 ms |
Cycle counts are measured in RTL simulation. The report specifies a 10 ns testbench period. The latencies above are calculated at an assumed 20 MHz; they are not stopwatch measurements on a board. Routed timing evidence applies only to its stated out-of-context implementation checkpoint. The 100 MHz simulation assumption is not used as a public hardware-throughput claim. The archived October 3 inference baseline remains 30,945 cycles; this October 11 checkpoint records 31,553. They are distinct design checkpoints.
The loader transferred 8,000 bytes in 2,002 cycles using 2,000 accepted requests and 2,000 responses. It recorded 0 request stall cycles and 0 additional response-wait cycles. Effective payload is 3.996 bytes per cycle (79.92 MB/s calculated at 20 MHz, using decimal MB).
Back-to-back 32-bit writes achieve 3.996 payload bytes per cycle, or 99.90% of the four-byte-per-cycle port ceiling. Two cycles cover startup and final response drain. This is simulated port payload efficiency, not measured host-to-board bandwidth. No memory-fabric RTL change was required. Inference fabric traffic is a separate observation window.
All seven streaming-loader vector suites passed with unchanged golden outputs and 2,319 inference-fabric transactions. Invalid-region, misaligned-address and out-of-range tests passed; a four-cycle injected response-backpressure test preserved valid contents. The earlier serialized checkpoint also passed malformed-response tests for byte and word write adapters.
Earlier serialized-loader verification tag: stage3n-dma-end-to-end-verified. The streaming report supplies pre-report source revision 9ebd4b1d5ab075a19f841f51a0ef1bf335ed73f1; no streaming verification tag is claimed here.
Increasing tokens from four to eight while holding D=8 and eight layers fixed increased inference cycles from 31,553 to 68,673 (117.64%). Accepted fabric requests increased from 2,319 to 2,895, while request stalls remained at seven client-cycles and response backpressure remained zero in this test.
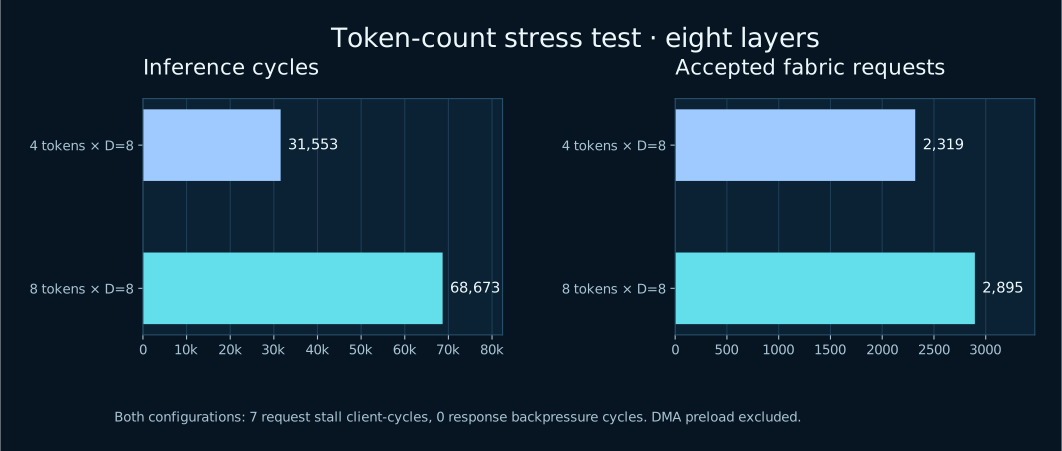
| Metric | 4 tokens × D=8 | 8 tokens × D=8 |
|---|---|---|
| Inference cycles | 31,553 | 68,673 |
| Softmax cycles | 1,176 | 3,352 |
| Requests accepted | 2,319 | 2,895 |
| Responses accepted | 2,319 | 2,895 |
| Request stall client-cycles | 7 | 7 |
| Response backpressure cycles | 0 | 0 |
| Scratch bytes | 1,024 | 2,048 |
These results establish verification for the two reported token counts. They do not establish scaling to larger embedding dimensions or full-model workloads.
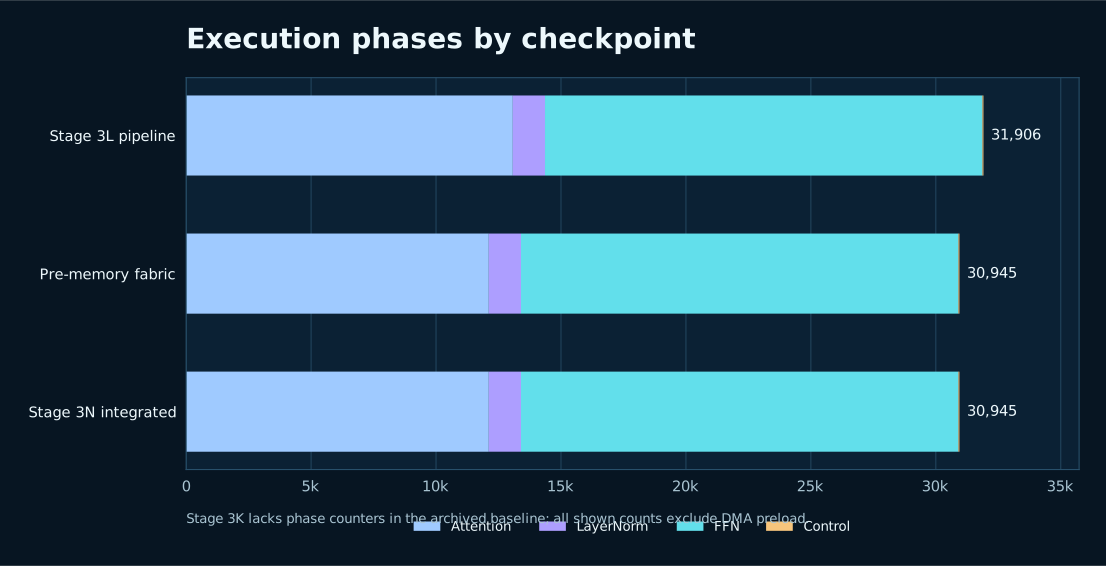
The recorded cycle count fell across the pipeline and projection-overlap stages before memory-fabric integration. In this test, the integrated fabric preserves the pre-fabric compute total of 30,945 cycles; it has not reduced that total.
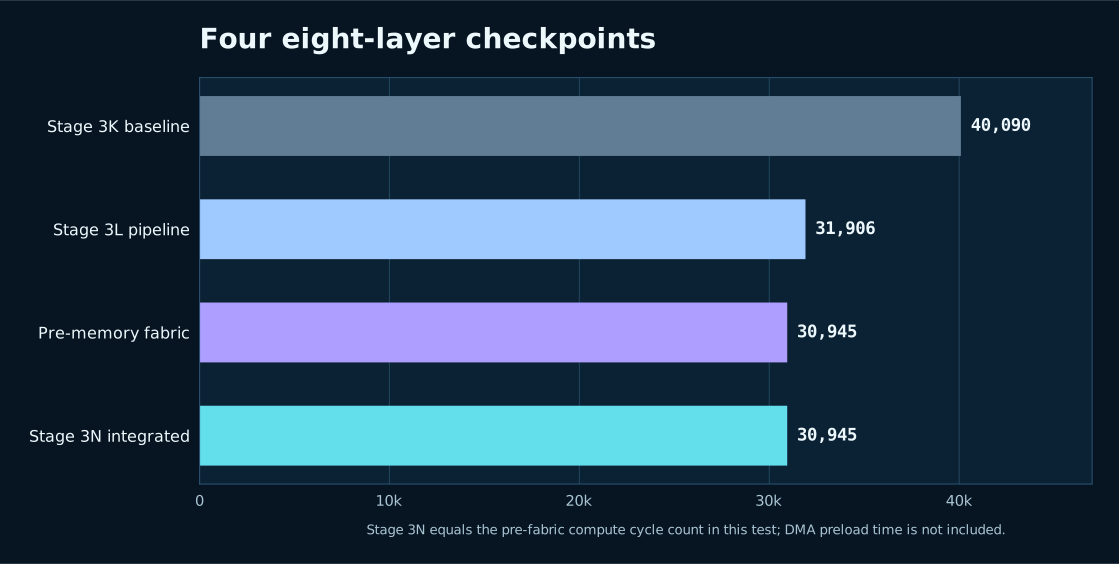
Compute latency reached 30,945 cycles and stayed there through integration. The Stage 3N fabric shows 2,319 accepted requests with 7 request stall client-cycles in this measured compute window.
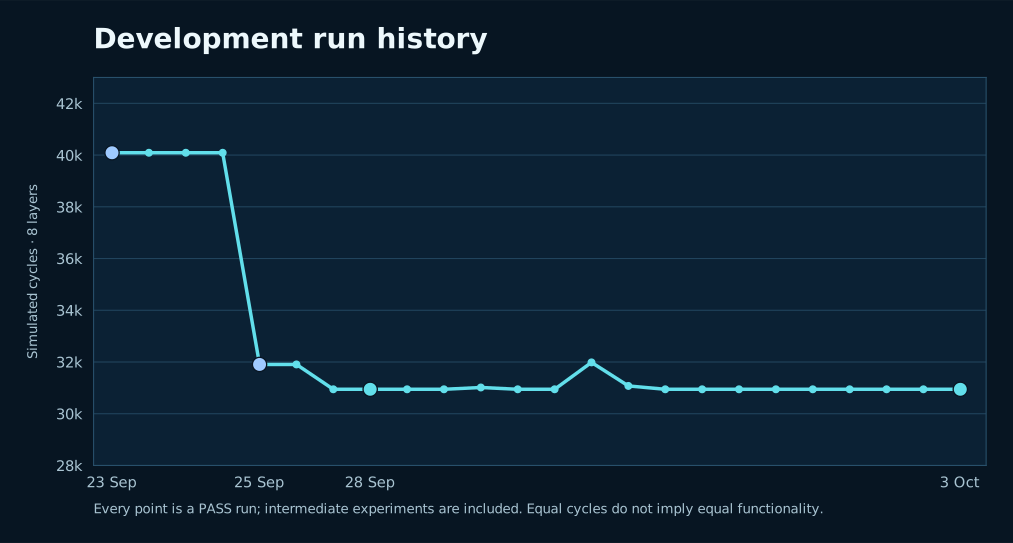
3,263 active · 27,682 idle cycles
The active-cycle ratio is the fraction of the inference window in which the fabric was active. Compute engines may be working during fabric-idle cycles. Request efficiency here is accepted requests ÷ (accepted requests + request stall client-cycles); it describes this reported test, not a measured hardware throughput rate.
| Inference cycles | 30,945 |
|---|---|
| Fabric active cycles | 3,263 |
| Fabric active-cycle ratio | 10.54% |
| Requests accepted | 2,319 |
| Request stall client-cycles | 7 |
| Request efficiency | 99.70% |
| Reads / writes | 1,743 / 576 |
| Response backpressure cycles | 0 |
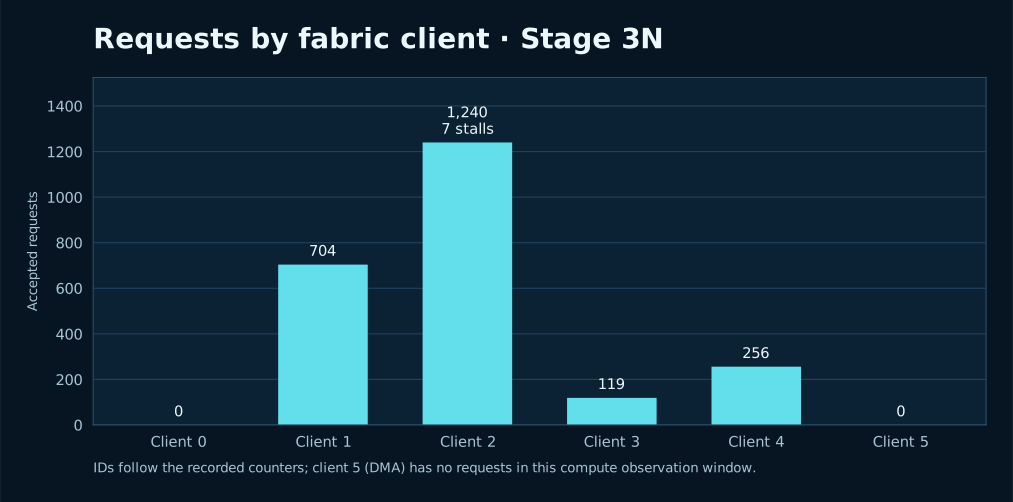
The archived October 3 run is marked PASS for the verified DMA loader. Its reported total_cycles cover the eight-layer compute run; DMA client 5 has 0 requests in those counters. They do not quantify preload cycles, bandwidth or end-to-end latency including model loading.
Development synthesis snapshot · 4 October 2026
In a Yosys Xilinx 7-series (XC7) synthesis comparison, the synchronous-read fabric-bank design mapped to 2 RAMB36E1 and 2 RAMB18E1 blocks, equivalent to three BRAM36 blocks. Distributed RAM cells fell from 841 to 233 (72.3% fewer). The reported verification retained the 30,945-cycle eight-layer inference result.
| Mapped resource | Before | After |
|---|---|---|
| RAMB36E1 | 0 | 2 |
| RAMB18E1 | 0 | 2 |
| Distributed RAM cells | 841 | 233 |
| LUTs | 13,954 | 13,607 |
| Flip-flops | 14,164 | 14,073 |
| DSP48E1 | 72 | 72 |
Provisional working-tree snapshot: the source contained uncommitted changes, so the recorded Git revision alone does not reproduce this result. These are mapped synthesis resource counts for the XC7 family, not placed-and-routed timing, power, or a percentage of a specific FPGA device. DMA preload traffic and latency remain outside the reported inference window. A clean-revision XC7 synthesis rerun is planned. Timing optimization and board-level evaluation remain next steps.
Expand a checkpoint for the full measurement format. “Not recorded” means the archived run did not supply a value; it does not mean zero. The fabric counters shown for Stage 3N cover the observed compute window.
Command-ahead descriptor queue verification
4 tokens × D=8 × 8 layers, with 4Q/2KV GQA, RoPE and 25 descriptors for the descriptor transports.
| Metric | Raw DMA | Explicit descriptor | Queued descriptor |
|---|---|---|---|
| Golden suites passed | 7/7 | 7/7 | 7/7 |
| Layer comparisons passed | 56/56 | 56/56 | 56/56 |
| DMA words loaded | 1,872 | 1,872 | 1,872 |
| DMA load cycles | 1,874 | 1,973 | 1,901 |
| Inference cycles | 34,225 | 34,225 | 34,225 |
| End-to-end cycles | 36,099 | 36,198 | 36,126 |
| DMA boundary cycles | 2 | 101 | 29 |
| Load overhead versus raw (cycles) | 0 | 99 | 27 |
| Effective payload (bytes/cycle) | 3.995 | 3.795 | 3.938 |
| DMA request stall cycles | 0 | 0 | 0 |
A one-entry pending queue reduces descriptor loading overhead from 99 to 27 cycles relative to raw DMA, recovering 72 cycles (72.73% of the original overhead). This percentage describes descriptor overhead recovery, not total inference speedup.
Compared with explicit descriptors, queued loading falls from 1,973 to 1,901 cycles and end-to-end execution falls from 36,198 to 36,126 cycles. Inference remains unchanged at 34,225 cycles. Raw DMA remains the lowest-cycle transport in this comparison.
1,901 preload + 34,225 inference = 36,126 end-to-end cycles. The reported total includes overlapped preload activity; no separate cache warm-up duration is added. Boundary cycles are already included in DMA load cycles.
Raw, explicit descriptor and queued descriptor transports each passed all seven suites and 56 layer comparisons: 168 matching layer comparisons across the three transports. DMA request stalls were zero for every transport.
One descriptor executes while one pending descriptor may be retained. At the terminal response, the pending region, base address and word count become active automatically. Tags restart for each descriptor; errors or reset flush both active and pending state.
Measurement scope: RTL simulation of the stated verification configuration. This report provides no new mapped resource counts or routed timing result. Zero DMA request stalls refers to the loader window, not all compute-client activity.
Source revision:
31be54e63dfe8d4e11ab0bea23c70a3b18b41be4.
Descriptor interface verification and overhead
4 tokens × D=8 × 8 layers, with 4Q/2KV GQA and RoPE. The raw request/response loader and descriptor command plus streaming-data interface passed the same seven vector suites.
| Metric | Raw DMA | Descriptor DMA |
|---|---|---|
| Golden suites passed | 7/7 | 7/7 |
| Verified layer comparisons | 56/56 | 56/56 |
| DMA words loaded | 1,872 | 1,872 |
| DMA bytes loaded | 7,488 | 7,488 |
| DMA load cycles | 1,874 | 1,973 |
| Cache warm-up duration (overlaps preload) | 337 | 337 |
| Inference cycles | 34,225 | 34,225 |
| End-to-end cycles | 36,099 | 36,198 |
| DMA stream-boundary cycles | 2 | 101 |
| DMA requests accepted | 1,872 | 1,872 |
| DMA responses accepted | 1,872 | 1,872 |
| DMA request stall cycles | 0 | 0 |
| DMA response-wait cycles | 0 | 0 |
| Effective DMA payload (bytes/cycle) | 3.995 | 3.795 |
| Inference-fabric transactions | 2,207 | 2,207 |
The descriptor path uses 25 commands: one activation descriptor and three per layer for attention weights, FFN weights and LayerNorm parameters.
Setup and drain add 99 cycles: 5.283% additional DMA loading time and approximately 0.274% additional end-to-end cycles. Effective payload falls approximately 5.006%. Inference remains unchanged at 34,225 cycles, with zero DMA request stalls and response-wait cycles.
Raw: 1,874 + 34,225 = 36,099 cycles.
Descriptor: 1,973 + 34,225 = 36,198 cycles.
Cache warm-up overlaps preload and is not added separately.
Stream-boundary cycles are already included in DMA load cycles.
Each transport passed seven suites and 56 layer comparisons, giving 112 verified layer comparisons across both transports. Each run retained 2,207 inference-fabric transactions.
The interface preserves response-safe DMA ownership: descriptor commands cannot start while a raw transaction is outstanding, and raw requests cannot enter the fabric while a descriptor is active.
The descriptor interface is intended for runtime and SDK integration. Command queueing and descriptor chaining are next optimization targets; their performance benefits have not yet been measured here.
Measurement scope: RTL simulation of the stated small verification configuration. This report supplies no new resource counts or routed timing result. Zero DMA stalls does not imply zero stalls across all compute clients.
Source revision:
9aafb83c440c4db04a9d92657f2165c919c8c85b.
Concurrent weight loading verified checkpoint
INT8, 4 tokens × D=8 × 8 layers, 4Q/2KV GQA with four-phase RoPE. DMA weight writes use a dedicated second memory port while compute clients continue through the existing arbitrated port.
| Metric | Before | DMA bypass |
|---|---|---|
| DMA load cycles | 2,090 | 1,874 |
| DMA request stall cycles | 216 | 0 |
| Cache warm-up duration (overlaps preload) | 384 | 337 |
| Inference cycles | 34,225 | 34,225 |
| End-to-end cycles | 36,315 | 36,099 |
| Effective DMA payload (bytes/cycle) | 3.582 | 3.995 |
1,874 preload + 34,225 inference = 36,099 end-to-end cycles. Cache warm-up overlaps preload and is not added separately. The bypass removes 216 DMA stall cycles and saves 216 end-to-end cycles (0.595%). Effective DMA payload increases approximately 11.53%; inference cycles remain unchanged.
All seven golden-vector suites passed with 56 independent layer-output comparisons and 2,207 inference-fabric transactions. The fabric passed 200 randomized rounds, concurrent cache-read/DMA-weight-write testing, and reset flush with memory preservation. DMA response-wait cycles were zero; two stream-boundary cycles remained.
Zero DMA request stalls refers to the preload measurement window; it is not a claim that all inference-fabric stalls were removed.
| Resource | Before | DMA bypass | Change |
|---|---|---|---|
| LUT4 | 23,512 | 23,623 | +111 |
| Flip-flops (TRELLIS_FF) | 20,249 | 20,344 | +95 |
| Block RAM (DP16KD) | 8 | 8 | 0 |
| Multipliers (MULT18X18D) | 76 | 76 | 0 |
| Total cells | 50,173 | 50,410 | +237 |
The design retains eight DP16KD block-RAM primitives and 76 multiplier primitives, adding 111 LUT4 primitives and 95 flip-flops. Total mapped cell count increases by 237.
Scope: Cycle results are measured in RTL simulation. Resource counts describe FPGA mapping. This report supplies no new routed frequency or timing-closure result for the bypass revision; the earlier 22.08 MHz result belongs to the preceding four-phase checkpoint.
Only DMA weight writes use the dedicated port. DMA reads, non-weight DMA traffic and compute clients retain their existing paths. Different-address concurrent cache reads and DMA writes are supported; same-address concurrent accesses are rejected by an assertion.
Source revision:
b13aafa1e3320cd8b9bc2769d07a925c47133042.
Numerically verified GQA and RoPE checkpoint
4 tokens × D=8 × 8 layers, with four query heads, two KV heads, and RoPE enabled. RoPE schedules one multiplier over four phases.
| Metric | Result |
|---|---|
| DMA preload cycles | 2,090 |
| Cache warm-up duration (overlaps preload) | 384 |
| Inference cycles | 34,225 |
| End-to-end cycles | 36,315 |
| Attention cycles (within inference) | 15,392 |
| Q projection cycles (within attention) | 2,128 |
| K projection cycles (within attention) | 1,104 |
| DMA words / bytes loaded | 1,872 / 7,488 |
| DMA requests / responses accepted | 1,872 / 1,872 |
| DMA request stall cycles | 216 |
| DMA response-wait cycles | 0 |
| DMA payload | 3.582 bytes/cycle |
| Inference-fabric transactions | 2,207 |
| Inference-fabric request stall client-cycles | 7 |
| Inference-fabric response backpressure cycles | 0 |
| Golden-vector suites passed | 7/7 |
| Layer comparisons passed | 56/56 |
2,090 preload + 34,225 inference = 36,315 end-to-end cycles. Cache warm-up overlaps preload; its 384 cycles are not added separately. Attention and projection counters describe work within inference and are not additional end-to-end phases.
| Architecture | DSP blocks | Inference cycles |
|---|---|---|
| Parallel RoPE | 88 | 34,177 |
| Two-phase RoPE | 80 | 34,193 |
| Four-phase RoPE | 76 | 34,225 |
Four-phase RoPE saves 12 DSP blocks versus parallel RoPE, adding 48 inference cycles across eight layers (0.140%). Compact GQA retains the 128-word reduction in DMA loading versus the original 2,000-word Stage 3N image: 1,872 words, or 6.4% fewer.
| Timing target | 20 MHz — PASS |
|---|---|
| Routed maximum frequency | 22.08 MHz |
| Remaining routing overuse | 0 |
| LUT4 primitives | 23,512 |
| Flip-flop primitives | 20,249 |
| DP16KD block-RAM primitives | 8 |
| MULT18X18D multiplier primitives | 76 |
Verification scope: All seven eight-layer golden-vector suites passed, with all 56 layer comparisons matching the independent Python model. This numerical verification applies to this October 15 GQA + RoPE checkpoint; earlier traffic-only results retain their original verification scope.
Measurement scope: Cycle counts are from RTL simulation; frequency and resources are from FPGA implementation tools. These results do not establish measured board throughput or full-model performance. The four RoPE phases describe multiplier scheduling, not four sequential load-to-result phases. DMA stall counters and inference-fabric stall client-cycles cover different measurement windows.
RTL revision:
c4713f9b1e33e7ee3d1073be1df586ca2b945b17.
Report-generation revision:
e978110c474af2f09db1e38b4659d5a91c98acf2.
Routed implementation milestone
The integrated 4Q/2KV design completed out-of-context placement and routing on a Lattice ECP5-85K. Routed Fmax reached 21.72 MHz, with 3.96 ns positive slack at the 20 MHz target.
| Metric | 1Q/1KV default | 4Q/2KV GQA |
|---|---|---|
| Routed Fmax | 23.61 MHz | 21.72 MHz |
| Minimum clock period | 42.36 ns | 46.04 ns |
| Slack at 20 MHz | +7.64 ns | +3.96 ns |
| Critical-path logic delay | 14.74 ns | 13.78 ns |
| Critical-path routing delay | 27.62 ns | 32.26 ns |
| Synthesized LUT4 primitives | 18,579 | 22,662 |
| Synthesized flip-flop primitives | 14,225 | 19,384 |
| Block RAM primitives (DP16KD) | 8 | 8 |
| Multiplier primitives (MULT18X18D) | 72 | 72 |
Both implementations meet the 20 MHz constraint. GQA uses more LUTs and registers while retaining eight block-RAM primitives and 72 multiplier primitives. Critical-path logic delay decreased, while routing delay increased.
Comparison scope: This physical comparison uses the 1Q/1KV default implementation. The separate traffic benchmark compares 4Q/4KV MHA with 4Q/2KV GQA; its cycle and traffic reductions belong to that matched four-query-head comparison.
Measurement scope: Out-of-context placement and routing, not a board measurement. Board-level I/O, complete system timing and external-memory interface timing are excluded. Full-stack golden-output comparison was not performed for the previously reported integrated 4Q/4KV and 4Q/2KV traffic runs; independent GQA numerical tests passed.
Target: LFE5U-85F, CABGA381, speed grade 8. Flow: Router2, seed 2, heap placement beta 0.75, alternate Router2 weights enabled.
Source revision:
8772029e87b7c42d80e6b075907b80a972627069.
GQA traffic and cycle benchmark
4 tokens × D=8 × 8 layers. Compare four query heads with four KV heads (MHA) against four query heads with two KV heads (GQA).
| Metric | 4Q/4KV MHA | 4Q/2KV GQA | Reduction |
|---|---|---|---|
| DMA words | 2,000 | 1,872 | 6.40% |
| DMA bytes | 8,000 | 7,488 | 6.40% |
| DMA load cycles | 2,234 | 2,090 | 6.45% |
| Cache warm-up duration (overlaps DMA) | 400 | 384 | 4.00% |
| Inference cycles | 36,161 | 34,113 | 5.66% |
| End-to-end cycles | 38,395 | 36,203 | 5.71% |
| Attention cycles | 17,328 | 15,280 | 11.82% |
| K projection cycles | 2,072 | 1,048 | 49.42% |
| V projection cycles | 2,072 | 1,048 | 49.42% |
| Inference-fabric transactions | 2,319 | 2,207 | 4.83% |
| Weight-region requests | 1,624 | 1,512 | 6.90% |
| Attention-client requests | 704 | 592 | 15.91% |
| Fabric request stall client-cycles | 7 | 7 | 0.00% |
| Response backpressure cycles | 0 | 0 | Unchanged |
Cache warm-up overlaps DMA loading. End-to-end accounting is 2,234 + 36,161 = 38,395 cycles for MHA and 2,090 + 34,113 = 36,203 cycles for GQA. Warm-up durations are not added separately.
Attention-weight storage falls from 64 to 48 words per layer (25%). The complete model image loses 128 DMA words (6.40%). Seven subsequent layer preloads remove 112 inference-fabric requests. Combined K/V projection savings of 2,048 cycles account for the inference-cycle reduction.
Verification scope: Independent GQA D2 and D3 numerical tests passed, as did the 2Q/2KV integration test and all seven legacy golden-vector suites. The integrated comparison runs passed output-count, memory-mirror and fabric-accounting checks. Full-stack golden-output comparison was not performed for the integrated 4Q/4KV and 4Q/2KV runs; the existing goldens describe legacy attention.
This comparison uses a different attention configuration from the earlier 31,553-cycle inference checkpoint. Compare MHA and GQA within this table; it is not a direct optimization comparison against that earlier checkpoint.
Source revision before report commit:
d29c643c8c9ef0c0576515cf855f73a72dacc6c0.
Overlapped cache preload verified checkpoint
4 tokens × D=8 × 8 layers. Layer-0 cache warming overlaps DMA loading of later layers.
| Metric | Sequential warm-up | Overlapped warm-up |
|---|---|---|
| DMA load cycles | 2,002 | 2,234 |
| Cache warm-up duration | 337 | 400 (overlaps DMA) |
| DMA request stall cycles | 0 | 232 |
| Inference cycles | 31,553 | 31,553 |
| End-to-end cycles | 33,892 | 33,787 |
| DMA payload bytes/cycle | 3.996 | 3.581 |
2,234 DMA + 31,553 inference = 33,787 elapsed cycles. The 400-cycle warm-up is hidden within DMA loading and is not added separately.
Weight-bank arbitration adds 232 DMA stall cycles. Removing the separate 337-cycle warm-up saves a net 105 cycles (0.31%). Calculated at the reported 20 MHz frequency, total latency is 1.68935 ms, saving 5.25 microseconds. These are simulation-cycle conversions, not board stopwatch measurements.
Seven eight-layer vector suites passed with unchanged golden outputs and 2,319 inference-fabric transactions. Depths 1, 2, 4 and 8 were verified. At depths 2, 4 and 8, warm-up was hidden and DMA stalls remained at 232. Loader negative and response-backpressure tests passed.
The DMA preload stalls belong to a different measurement window from the archived inference-fabric stall counters.
Source revision before report commit:
bd6f4ee69454bb82227742ab1e99ff9eaa55377a.
Streaming DMA verified checkpoint
4 tokens × D=8 × 8 layers. Includes DMA preload, cache warm-up and inference.
| DMA load cycles | 2,002 |
|---|---|
| Cache warm-up cycles | 337 |
| Inference cycles | 31,553 |
| End-to-end cycles | 33,892 |
| DMA bytes loaded | 8,000 |
| DMA requests accepted | 2,000 |
| DMA responses accepted | 2,000 |
| DMA request stall cycles | 0 |
| DMA additional response-wait cycles | 0 |
| Effective DMA payload | 3.996 bytes/cycle |
| Inference-fabric transactions | 2,319 |
| Vector suites passed | 7 |
DMA loading fell 49.95% and end-to-end cycles fell 5.57% versus the serialized loader. Inference cycles remained unchanged.
| Inference cycles | 40,090 |
|---|---|
| DMA load cycles | Not recorded |
| End-to-end cycles | Not recorded |
| Requests accepted | Not recorded |
| Responses accepted | Not recorded |
| Request stall client-cycles | Not recorded |
| Response backpressure cycles | Not recorded |
| Read requests | Not recorded |
| Write requests | Not recorded |
| Requests by region | Not recorded |
| Requests by client | Not recorded |
| Stalls by client | Not recorded |
| Active fabric cycles | Not recorded |
| Idle fabric cycles | Not recorded |
| Layers | 8 |
| D | Not recorded |
| Vector size | Not recorded |
| FFN hidden size | Not recorded |
| Assumed clock period (ns) | 10 |
| Inference cycles | 31,906 |
|---|---|
| DMA load cycles | Not recorded |
| End-to-end cycles | Not recorded |
| Requests accepted | Not recorded |
| Responses accepted | Not recorded |
| Request stall client-cycles | Not recorded |
| Response backpressure cycles | Not recorded |
| Read requests | Not recorded |
| Write requests | Not recorded |
| Requests by region | Not recorded |
| Requests by client | Not recorded |
| Stalls by client | Not recorded |
| Active fabric cycles | Not recorded |
| Idle fabric cycles | Not recorded |
| Layers | 8 |
| D | Not recorded |
| Vector size | Not recorded |
| FFN hidden size | Not recorded |
| Assumed clock period (ns) | 10 |
| Inference cycles | 30,945 |
|---|---|
| DMA load cycles | Not recorded |
| End-to-end cycles | Not recorded |
| Requests accepted | Not recorded |
| Responses accepted | Not recorded |
| Request stall client-cycles | Not recorded |
| Response backpressure cycles | Not recorded |
| Read requests | Not recorded |
| Write requests | Not recorded |
| Requests by region | Not recorded |
| Requests by client | Not recorded |
| Stalls by client | Not recorded |
| Active fabric cycles | Not recorded |
| Idle fabric cycles | Not recorded |
| Layers | 8 |
| D | Not recorded |
| Vector size | Not recorded |
| FFN hidden size | Not recorded |
| Assumed clock period (ns) | 10 |
Memory-fabric reference baseline
| Inference cycles | 30,945 |
|---|---|
| DMA load cycles | Not recorded |
| End-to-end cycles | Not recorded |
| Requests accepted | 2,319 |
| Responses accepted | 2,319 |
| Request stall client-cycles | 7 |
| Response backpressure cycles | 0 |
| Read requests | 1,743 |
| Write requests | 576 |
| Requests by region | activation: 256 weight: 1,624 parameter: 119 scratch: 256 output: 64 |
| Requests by client | 0: 0 1: 704 2: 1,240 3: 119 4: 256 5: 0 |
| Stalls by client | 0: 0 1: 0 2: 7 3: 0 4: 0 5: 0 |
| Active fabric cycles | 3,263 |
| Idle fabric cycles | 27,682 |
| Layers | 8 |
| D | Not recorded |
| Vector size | Not recorded |
| FFN hidden size | Not recorded |
| Assumed clock period (ns) | 10 |
The run metadata specifies eight layers and a 10 ns assumed period. It does not establish FPGA clock frequency, physical area, power, TOPS, tokens per second or model-level throughput. DMA loading and token-count stress results are now reported above. Larger-dimension tests, timing optimization and board-level measurements remain next steps.